Answers
Viewing different statistics on your event (ticket sales, distribution, etc.)
Use the Stats tool to view statistics on individual events, using a select date range to filter results even further. To access your stats page, follow the instructions below.
- Log in to your Purplepass event organizer dashboard
- Click My Events at the top navigation bar

- You can either select Stats located to the right of each listed event, or you can click Stats from the top navigation bar
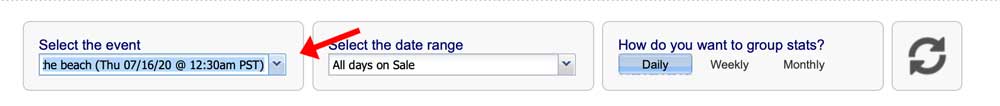
- Choose your event from the drop-down menu labeled Select the event
- Click the first tab on the top of the page with the label you want to view
Ticket Sales - On this tab, you can view all information on your ticket sales, including ticket sales per type, date of sale, breakdown of types sold, order details, and more.
Distribution - Here you can see how each ticket is sold, the ticket type, method of payment, revenue, and order information.
Passes/Packages - This tab allows you to view all revenue generated by any passes or package ticket type sales, track tickets sold, distribution channels, and order information. For more information on viewing statistics on your passes/packages tab, click here.
POS - This tab provides information on your box office sales including sales from each terminal and method of sale. For more information on setting up your mobile box office, click here.
Geography - This tab breaks down ticket sales according to location. The map provided will pinpoint locations, and the graphs at the bottom will provide data based on ticket percentages for each area.
Attendance - The Attendance tab shows the flow of attendance in increments of ten minutes (tracking your attendance). It will also show how they were admitted. Scanner numbers will also be available on the page.
Marketing - You can see information about the location of ticket sales and original sources under the marketing statistics tab. You can also view tracking code information in the box located in the lower-left corner. There is a bar and line graph for reference at the top of the screen for measuring results and movement as your event gets closer. You can also see views, unique views, revenue, orders, and refund information from this screen.
Social Marketing - The Social Marketing tab lists all of the likes that were generated during ticket sales at checkout. You can also see how many people shared the event as well as how many Facebook check-ins were generated at the event.
Promo codes - This tab allows you to view all promo codes used when purchasing tickets or being applied to an event. You can see calculations of total deduction price, gross revenue, net revenue, refunds, and more ticket information where a code has been applied. Click here for more information on viewing stats on promo codes.
To view your seating map stats, follow these instructions.