


7 Virtual Event Reports for Measuring Results
Measuring the results of virtual events isn’t that different from in-person events. However, there are a few elements and virtual event reports you would want to consider, more so than you would for an in-person event.
Don’t let the world of virtual events intimidate you.
People are still watching, just online. Guests can still engage via chat bots or in the comments section on your live streamed videos. Just like in-person events, measuring your success post-event and ticket sales analytics is crucial for identifying what works and what doesn't for any future events online.
What needs improvement for next year’s event?

Registration Reporting
Whether you’re trying to manage guest lists or just need a central place for providing information on your event, tickets, RSVP options etc., you will probably need a registration software. A ticket registration is great, not just for selling tickets. Most software comes with extensive reporting for further breakdown on event traffic online.
Before picking your registration, it's important to look at their reporting options and make sure they include:
-
Marketing reports for monitoring direct traffic, traffic sources and tracking codes so you can see what channel brought in the most sales.
-
Customer and demographic reports to see who is attending your events and to better understand your target market for future events.
-
If you’re working with partners or running an affiliate program, find a ticket registration with tracking codes for commission and sales-tracking purposes.
- Event ticketing analytics and breakdown reporting
|
Building custom reports with Purplepass Accounting reports, invoices,
|

Real-Time Alerts
These are sales alerts that happen in real time; as the sale is being made or after completion of a purchase. If you are charging people for your event or asking for guests to RSVP, these types of alerts can automate the process of checking your sales.
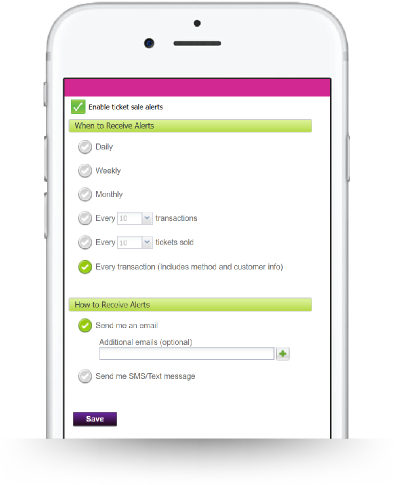 For example, Purplepass users have the option of receiving alerts for every sale made, X number of sales, X number of tickets purchases, etc. Alerts can be sent out daily, weekly or monthly. This is a brilliant tool for understanding your trends and patterns on when people are purchasing tickets and what they are purchasing.
Most software might offer real-time alerts for your virtual event reports or for the tool you are using. If you don’t see it ask customer support, as it might not be advertised.
Total Views and Duration
Because your event is fully online, it’s important to know your total views and how long guests stayed to watch your event. These stats will tell you two things.
-
How many people tuned in to watch your event (total audience)
-
How long do they stay to watch? Especially for a free event, if they popped in for a minute then left, you wouldn’t count that as a successful guest because they were briefly online.
Most streaming services will offer this type of reporting. Thanks to the suggestions from Epiphan Video, here are some top streaming software for live events:
*** Streaming means you are recording yourself or the event LIVE. It is not prerecorded. If something goes wrong, it is live for the entire audience to see.
Comments and Shares (engagement)
We always encourage event promoters streaming live to integrate with a comments tool or plugin. This gives guests the ability to comment live and interact with other guests online.
You also want to use reports that consider the number of comments your video receives live to translate average engagement throughout your event. The number of shares can also show you how many people felt your video was valuable enough to pass on.
Software that supports commenting:
Instagram live
Facebook live
WordPress plugins for live streaming:
bzlayer Pro
YouTube Live Stream
Free Live Stream
Embed Plus for YouTube
Ticket Sales and RSVPs
Whether your event is paid or free, having the ability to track sales with a ticket sales report is beneficial for tracking guests count pre and post-event. You can track this manually or through your ticket registration.
Either way, ticket stat reports represent the number of tickets or total interest (if RSVP) in your event plus total revenue post-event.
Reporting should include:
-
Sales by ticket type
-
By day
-
By price-point
-
RSVPs if free
-
Date range filter options
Geography Reports and Heat Maps
The beauty of live streaming is extending your audience reach by thousands around the world. In-person events can limit you to one area of the community, but virtual events are online with uncapped potential for reaching new audiences.
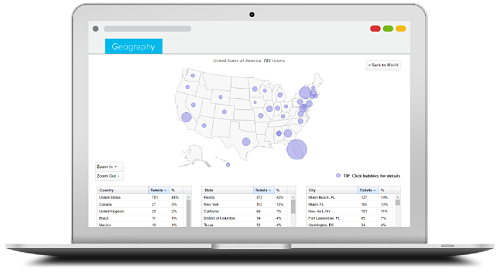
Geography reports that include heat mapping (a technique that shows magnitude using color and shapes) can show you what locations are tuning into your events; possible areas you never would have considered to be watching.
Knowing customer demographics can be used to define your target market in further detail and adjust current marketing campaigns for the different locations watching.
Attendance Reports (times people joined online)
Look for a live streaming service that also offers reports on total attendance/views, times they joined and total duration. As we previously mentioned, for virtual events you can’t go off of just total views, because that could count for someone who logs in for a minute then logs off.
You need to also account for the total time they stayed and watched your event plus at what time they jumped off. This can give you an idea of where engagement is lacking, especially if the pattern of exiting your event was consistent.
YouTube Analytics, a platform used by billions for sharing videos, breaks down video watch time with a further breakdown of the average view duration. So, your views could be 70 hours that month, but if the average is only a few seconds, you know your videos are losing a lot of views and need more engagement.
|
If your event is free, so are we! Use Purplepass as your registration
|