


5 Web Analytics Reports You Need To Understand Your Ticket Sales
Over 30% of marketers say that having access to key data for analysis is the single most useful way to understand their customers.
We live in a data-rich marketing ecosystem. As event marketers, we want to know how, when, and why attendees are buying our tickets. After all, the better we understand our attendees, the easier it is to sell them tickets.
One of the biggest sources of data for event marketers is their event website. It’s the place where people first start to really engage with your event details. And, there’s a good chance it’s the spot where people buy your tickets.
But what website data really matters?
You can use services like Mailchimp, HubSpot, and most CMS dashboards to grab reports on thousands of different data points on your website. So which ones should you be paying attention to?
Here are the 6 website reports that can help show you how to boost ticket sales.
|
Recommended reports for ticketing There are various report types planners will want
|

1. Device Breakdown
Key question(s) to answer:
-
What types of devices are my visitors consuming my content on?
With around 50% of internet traffic coming from mobile devices and the other half coming from desktops and laptops, users are consuming content in a variety of ways.
It’s your job to make sure that you’re accommodating their browsing habits and devices. 77% of smartphone shoppers admit that they’re more likely to buy from a website that’s easily accessed on a mobile device.
You want to know what devices people navigating your website are using. It will help you tailor amazing, creative experiences to them in a hyper-digestible format.
2. Session Demographics
Key question(s) to answer:
- What is the geographic location of my ticket audience?
- What age and gender are my visitors?
While a plethora of the event audience comes from local sources, attendees can come from almost anywhere on the planet.
Understanding where people who browse your website are located helps you build more sophisticated buyer personas— leading to a more accurate overview of your audience.
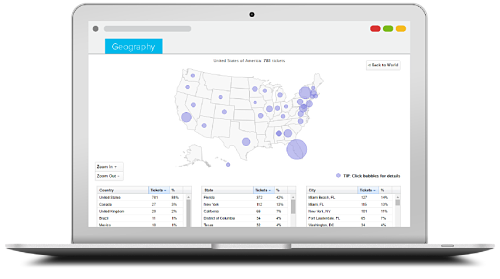
Of course, you’ll also have demographic information built into social media campaigns and other marketing channels.
But it’s important to hone in on your website visitors since they reflect your top-of-the-funnel SEO and bottom-of-the-funnel social audience.

3. Sessions by Source
Key question(s) to answer:
- What sources are bringing attendees to your website?
Event marketing involves plenty of buckets. You may use social media marketing, SEO, out-of-home (OOH) ads (like newspaper print), paid ads, digital audio ads, radio ads, or many advertising avenues to convince and convert your audience.
But how do you know if they’re really working?
You check your sessions by source. This tells you where visitors are originally coming from. Did they come from Bing or Google?
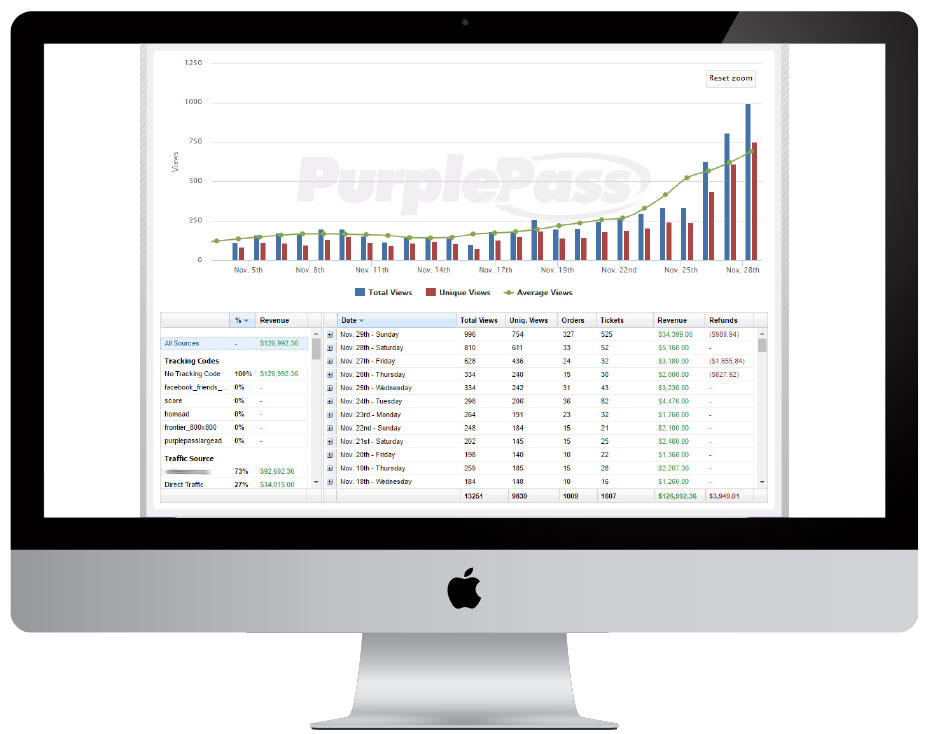
Did they click a link on Facebook? What got them to your website?
This information can help you adjust campaign strategies and maximize budgets to high-performing lead magnets.
4. Session Engagement Rates by Source
Key question(s) to answer:
- What sources are giving you the most engaged visitors?
Figuring out where people are coming from is one thing, discovering which one’s are the most valuable is a different ball game.
Did 80% of your audience come from Bing?
That’s great! But what if they’re 33% less engaged (and purchase-ready) than the ones from Google?
You may be putting too much money into Bing ads! You want to know which sources give you the most people and which ones give you the most engaged people. Both are important.
5. Behavior Reports
Key question(s) to answer:
- How are visitors navigating your website?
- What pages do visitors like?
- How long are visitors spending on your pages?
There are a nearly unlimited number of behavior-based reports you can view. But we recommend focusing on the reports that answer the three questions listed above.
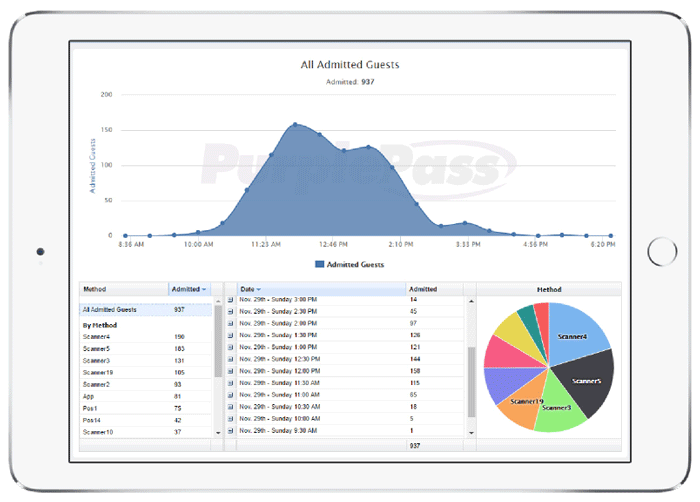
You want to know how they’re browsing your website and what kind of content they like the most. Are you losing a ton of people between two different web pages during your ticket purchasing process?
87% of shoppers will abandon their purchasing intent if the checkout process takes too long.
You want to dig deep and analyze your website for gaps. Any webpages that seem to be a source of friction should be reduced or eliminated.
The result should be a more focused, simple ticket buying experience for everyone involved.
|
Ticketing Stats, Reports and Data Purplepass offers a variety of custom reports from
|